
Ideation Digital specializes in strategic marketing services that drive results for your business or organization, let us show you how our SEO Services can help grow your business on auto-pilot.

Is your online presence strong but your sales numbers remain disappointingly low?
Do you feel invisible online and know it’s affecting your sales growth?
Wondering if your business website actually brings in any customers?
Invested in online marketing but not seeing any increase in sales or customer inquiries?
The problem is there is more competition than ever for attention online and having a "good enough" online presence isn't good enough to get you customers anymore.
At Ideation Digital marketing we focus on building websites and SEO marketing programs that get you customers and leads, because why else would you invest in your small business marketing?
We understand the business saving impact of knowing you are getting consistent online leads from your website and online marketing. We are small business owners too.
That's why we only create online marketing that is optimized to produce sales and results. A.I. powered organic and comprehensive marketing systems that leverage the power of A.I. to create an online presence that actually makes the phone ring.

Want to discover how much not having an A.I. powered organic marketing system is costing your business already?
Get our digital marketing cheat sheet, made from a decade of experience in the industry, and customized for your business with exact steps to get consistent leads from your online marketing and finally feel like your online marketing investment is worth it!
How It Works
1. Analyze and Create a Strategy
We audit your existing marketing and needs, and help you figure out where your best opportunities are and agree on a plan that fits your goals.
2. Fast Implementation
Based on your strategy, we create your website and other marketing assets within a week so that you get leads FAST, and we offer unlimited editing so that your online presence always looks its best.
3. You Get Leads
Our expert team implements effective online marketing strategies to bring in leads and improve your local visibility, putting you in front of the right people at the right time so they actually reach out.
4. We Make Sure You Keep Getting Leads
We continue to monitor and actively manage your website, SEO, and digital marketing campaigns, allowing you to focus on your business while it shines online.
Here's what you get working with us:
Trust
We only recommend products and services that align opportunities with your goals. We focus on results for your business first.
Freedom
We manage all campaigns and assets for you. Need an update? No problem, send us an email, a text, or we will even create you a slack channel.
Growth
We don't just build websites, create SEO plans, and run ads for online marketing campaigns, we create comprehensive a.i. powered organic and paid marketing programs that bring you leads and customers.
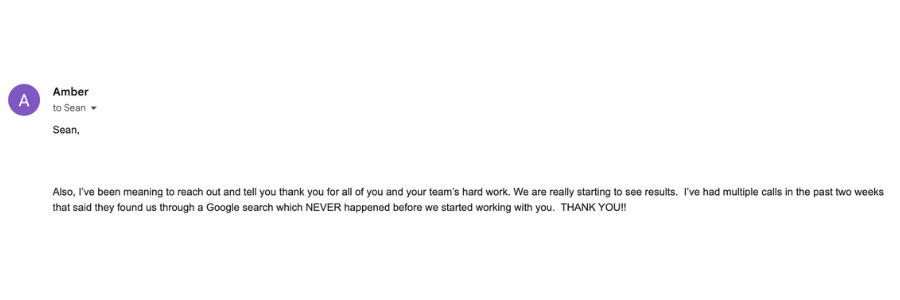
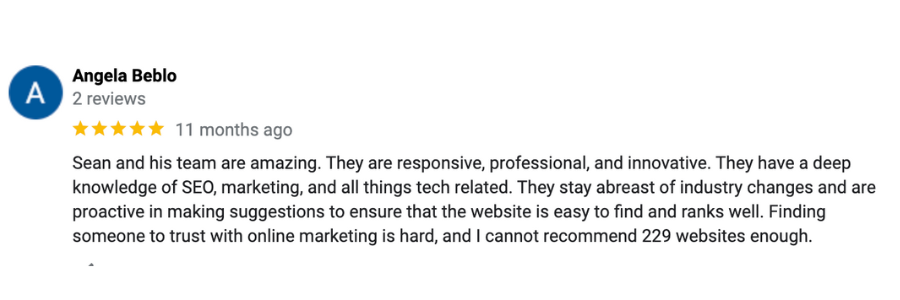
See What Small Business Owners are Saying About Working with Ideation Digital


The Best Analytics and Data Tools for Business Insights
In the ever-evolving digital landscape of 2024, extracting valuable insights from massive amounts of data has become a prerequisite for business success. This blog post will guide you through the best analytics and data tools on the market that have proven to drive strategic decision-making and optimize business performance. Discover how these powerful technologies can simplify your analytics journey, making it easy to convert raw data into actionable intelligence for unprecedented business insights. Let's navigate your path to smart and informed decisions that can revolutionize your business growth!

Analytics and data play a crucial role in businesses, allowing organizations to make informed decisions and improve outcomes. By leveraging data-driven decision-making processes, businesses can optimize operations, forecast risks, enhance supply chain responses, and understand customer segments. Analytics and data serve as catalysts for digital transformation, enabling faster and more accurate decision-making. To create an effective strategy, aligning goals, determining impact on goals, prioritizing action steps, building a roadmap, and implementing a modern operating model are necessary steps. Additionally, data literacy is crucial for individuals within organizations to understand data sources, analytical methods, use-case applications, and value.
Data and analytics governance ensures that decision rights and accountability for information assets are aligned with the overall business strategy. The future of analytics includes integrated platforms combining data management and analytics capabilities alongside composable architectures to support advanced analytics. Popular analytics tools include Google Analytics, Facebook Analytics, Tableau, Informatica, Qlik, PowerBI, Elasticsearch, Sinequa, Kraken by Big Squid, Airflow, Nifi, Alteryx. For beginners, recommended free tools include Google Analytics and Google Data Studio with limited free trials for Tableau. R is suggested for statistical programming and analysis as it is open source and free. Additional resources to explore could be completing the free Google Analytics training.
The Value of Analytics and Data in Business
Data has become one of the most valuable assets for modern-day businesses, as it enables organizations to make better decisions and improve outcomes. By leveraging analytics tools, companies can gain insights into customer behavior, optimize supply chain responses, forecast financial trends, and simulation models – enabling them to stay ahead of their competitors.
Think of data as a treasure trove – the more you dig deep, the more precious gems you'll unearth.
Given that over 2.5 quintillion bytes of data has been created every day, being able to use it effectively is critical. This is where analytics tools come in handy by providing meaningful insights that help companies achieve their business goals.
Enhancing Decision-Making with Data
Data-driven decision making means using data to improve decision-making processes. In other words, quantitative information supersedes intuition or gut instincts. This way of thinking empowers organizations to tap into new opportunities previously undetected while highlighting potential risks early on.
Consider a retail company that's looking to expand its operations but doesn't know which location is most suitable for setting up a new store. By leveraging data on customer footfalls, demographics, competitor analysis and consumer spending patterns - they can accurately identify optimal sites and predict expected revenue levels.
Analytics tools allow businesses to access relevant information in real-time so that they can respond appropriately. With innovative business intelligence or predictive analytics capabilities - companies can easily extract important trends from large datasets and translate them into actionable insights.
Having explored how data influences decision-making, let's take a closer look at how predictive analytics help companies become more efficient.
01
- Companies who adopt data-driven marketing are six times more likely to be profitable year-over-year (Forbes, 2020).
02
- According to research by Mckinsey, businesses that leverage customer behavioral insights outperform peers by 85 percent in sales growth and more than 25 percent in gross margin.
03
- Gartner's research revealed that around 87% of organizations have low business intelligence (BI) and analytics maturity, showing a major gap in tapping into the full power of data analysis.
Improving Efficiency through Predictive Analytics
In today's business world, technology is rewiring how we approach data analysis. The use of predictive analytics provides an opportunity to use patterns in historical data to forecast future outcomes with a high degree of accuracy. Predictive analytics involves combining and analyzing past data using techniques like machine learning, statistical algorithms, and modeling. By doing this, you can make better business decisions by identifying trends, patterns, behaviors, and anomalies in your customer and business data.
Think of it like solving a puzzle: predictive analytics helps you piece together various elements based on what's happened in the past to paint a picture of what might happen in the future.
Combining predictive analytics with the right data analysis tools can result in efficient, automated data processing that saves businesses time and money. Let's look at some of these tools below.
- In today's business world, the use of predictive analytics is revolutionizing how we approach data analysis. By leveraging techniques like machine learning and statistical algorithms, businesses can analyze historical data to accurately forecast future outcomes. This enables better decision-making by identifying trends, patterns, behaviors, and anomalies within customer and business data. Combining predictive analytics with the right data analysis tools can lead to efficient and automated data processing, saving businesses valuable time and resources.
Top Data Analysis Tools for Businesses
There are countless data analysis tools available for businesses today, but choosing the right one can be a daunting task. Considerations when choosing a data analytics tool include scalability, data compatibility, security features, real-time dashboard and reporting, compatibility with AI-driven technologies, and user reviews.
Here are some of the most widely used data analytics tools:
1. ThoughtSpot (best for business intelligence)
ThoughtSpot is rated highly on Gartner Peer Insights and offers an intuitive search experience, self-service analytics, granular data security control, integration with existing data pipeline, and real-time interactive Liveboards.
2. Mode(best for data exploration)
Mode provides a Notebook interface and Visual Explorer for ad-hoc analysis, advanced analytics capabilities in their visualization library, connectivity with multiple databases, and AI-based assistance.
3.
Looker serves as a semantic layer, offers data modeling, data visualization, embedded analytics, integration with Google Workspace, and multiple database integration.
4. Tableau (good for visualization)
Tableau is known for its vast library of interactive dashboards, drag-and-drop interface for customization of visualizations, connection to multiple data sources, statistical analysis capabilities, and building predictive models.
5. Sisense (good for traditional dashboards)
Sisense focuses on traditional dashboard-based reporting with features like Git integration, low-code interface for creating dashboards and reports, AI-powered exploration paths and explanations, integration with cloud data sources, and support for APIs and SDKs.
6. Knime (good for streamlining workflows)
Knime is an open-source platform supporting diverse data sources and types with features such as data cleaning and processing, machine learning algorithms, drag-and-drop visualizations, access to Python functionality, and the ability to build reusable workflows.
7. Microsoft Excel (good for basic visualization and reporting)
Microsoft Excel, popular for basic visualization and reporting tasks; although not specifically designed for analytics features like 'What-if' analysis may appeal to some.
The right combination of predictive analytics techniques alongside a data analysis tool geared towards your specific needs enables businesses to yield actionable insights from their rapidly expanding streams of customer and market data. The insights allow businesses to make informed decisions that position them strategically. However, businesses need to remember that analytics tools aren't magic wands; they require skilled individuals who can not only operate the tools but also interpret the results obtained. Therefore investing in upskilling employees within the organization on these tools will likely increase overall efficiency.
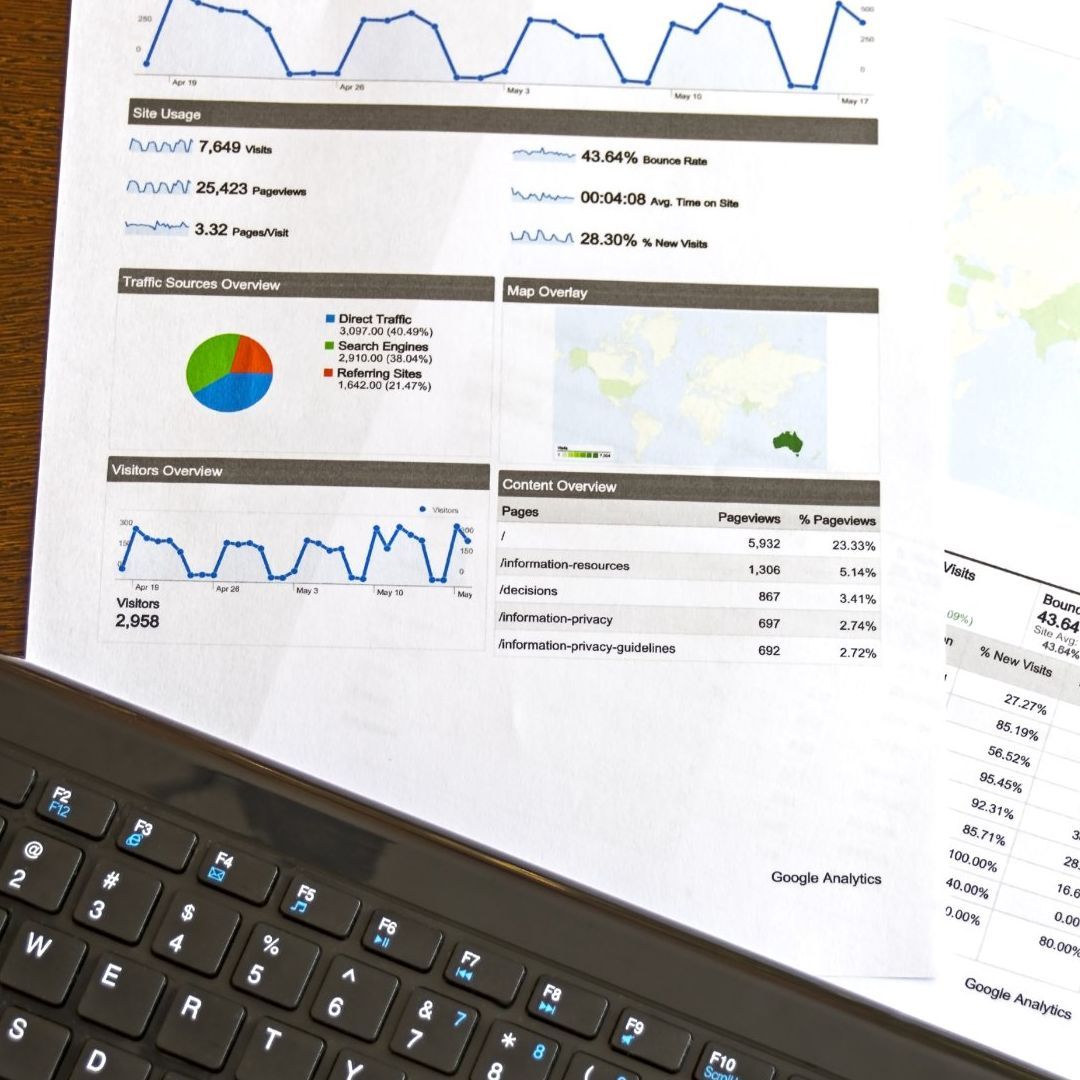
Google Analytics and Power BI
The integration of Google Analytics (GA4) and Power Business Intelligence (BI) tools enables businesses to combine their website data with other business metrics from various sources. The combined data is then displayed on a single dashboard, providing businesses with valuable insights that can guide their decision-making processes.
For instance, using the GA4 connector for Power BI gives users access to analytics reports such as active users and event tracking. With this data, businesses analyze user behavior trends based on specific products, demographics, location time-of-day among others. This information can also be visualized in customized reports through the use of Power BI's visualization capabilities.

Also noteworthy is the fact that there are three primary methods to connect GA4 with Power BI: 1. Utilizing a Third-Party Connector, 2. Using the Native Google Analytics Connector in Power BI, and 3. Connecting GA4 to Power BI via BigQuery.
| Method | Advantages | Disadvantages |
|---|---|---|
| Third-Party Connector | More versatile and features | Additional cost |
| Native GA Connector | Compatibility support | Data refresh restrictions |
| GA4 to Power BI via BigQuery | Unified data visualization | Configuration complexity |
| E-commerce Integration, Local Search Optimization |
Tableau and Informatica
Tableau Software and Informatica are two popular analytics tools used by many companies. Tableau allows companies to quickly visualize data and create interactive maps, charts, graphs, dashboards among others. Informatica specializes in enterprise-level data management solutions, specifically data integration, cloud services app integration among others.
Specifically, Tableau allows business owners to visualize complex data sets without needing in-depth technical expertise on data analysis. Informatica offers deeper insights into raw data by making it actionable using more advanced integrations.
Many organizations are turning towards Informatica big data management platforms for the ability to store, process, and analyze large amounts of unstructured data. In turn, they leverage Tableau analytics platforms for more user-friendly visual presentations.
Debate exists over the choice between using external tools such as Tableau to visualize data in comparison with building visualizations directly into Informatica within an ELT (extract, load, transform) strategy. However, regardless of which solution is purchased at first – or regardless of whether they’re integrated later – each tool can help organizations achieve greater insight into their data.
With this understanding of Analytics and Data Tools for Business Insights let's dive further into Key Metrics that your business must measure.
Key Metrics to Measure with Business Analytics
Data and analytics tools can help businesses make informed decisions and improve outcomes. A data-driven approach enables companies to measure key metrics that inform various aspects of the business, such as sales performance, customer acquisition, retention rates, and operational efficiency.
Think of these metrics as gauges on a car dashboard - they give you a real-time view of how well your vehicle is operating. Similarly, being aware of key metrics in your business can provide you with insights into how effectively your business is running.
Customer Behavior and Marketing Effectiveness

Businesses need to understand their customers' behavior to create effective marketing strategies. Analytics tools can provide insights into customer behavior that allow companies to optimize their marketing techniques accordingly.
Companies can track website and social media engagement rates through web analytics tools like Google Analytics or Facebook Analytics. By examining click-through rates, bounce rates, unique sessions over time and user paths through a site, companies can gain an understanding of overall engagement with specific website pages or advertisements. They can then tweak campaigns that are not driving traffic accordingly.
Marketing analytics tools like Tableau or Informatica can provide information about campaign spend across various channels. These insights allow you to measure the effectiveness of each channel and adjust resources accordingly.
Combining marketing analytics with data from customer relationship management (CRM) systems helps businesses improve overall customer experience by personalizing messaging according to past interactions.
For example, using Salesforce CRM together with its built-in integration for Google Analytics allows businesses to see which campaigns yielded the most contact form submissions or phone calls from potential clients.
This sort of tracking also enables companies to predict when certain events might lead to higher traffic (such as holidays generating interest in gift purchasing). Companies that use both CRM and web analytics benefit by responding proactively when conditions signal possible shifts in consumer demand patterns.
The role of data and analytics in business is to make better decisions and improve outcomes. Today, it applies to all types of decisions. Progressive organizations use data and analytics in many ways, relying on external data sources for smarter business decisions. Data-driven decision-making means using data to improve decision-making processes.
Let's say you are running a small e-commerce website that sells handmade crafts. By analyzing customer data (i.e., demographic information, purchase history, etc.), you can better understand what products sell best and who your target audience is. This analysis could inform future marketing strategies, product development plans, pricing strategies, etc.
Adapting a Data-Driven Approach for Business Insight
The key takeaway is to leverage data insights proactively, which requires a strategic approach that entails building an analytics strategy:
Steps to Build an Analytics Strategy
When it comes to optimizing your website for search engines, there are various types of SEO services available. These services aim to improve your website's visibility and ranking in search engine results pages (SERPs). Let's take a closer look at some of the common types of SEO services that can help boost your website's online presence.

Firstly determine your goal as a business or individual and align this with any other goals relating to data usage.
Secondly, consider what aspects of your business would most benefit from incorporating data insights such as - inventory management or marketing campaigns.
Much like planning a road trip: Determine your destination(goal), the route most conducive (what aspects of the business would most benefit from incorporating data insights) - think winding roads Vs highways - ,and then create a roadmap with estimated timelines.
Next up is prioritizing action steps based on achievable milestones such as time specific increments or appropriate financial margins in terms of budget allocations for tools needed while developing a designated team equipped with technical skills required.
Once the different elements are complete here comes implementation stage by making use of technology advancements using modern softwares like Qlik View or Power BI capable of incorporating Data Visualisation aiding in quick decision making.
All these steps will aid in taking your first step towards a more data-driven approach where the focus is on gaining insights for optimal business outcomes.
Overcoming Challenges in Data Analysis
Data analysis can be fraught with a variety of challenges that can hamper your ability to extract insights effectively. It's essential to identify the most common pitfalls so you can overcome them and provide accurate business insights.
The first challenge is data quality. Poor data quality can derail any analysis, regardless of how advanced your analytics tools are. Garbage in, garbage out: it's as simple as that. You need to prioritize identifying and addressing issues such as inconsistencies in formats, missing records, or inaccurate entries before you begin any analysis.
Another common obstacle to effective data analysis is a lack of understanding of the data being analyzed. If you don't know what you're analyzing or where the data comes from, it will be difficult to glean meaningful insights from it. It's crucial to invest time upfront learning about the data and its sources, understanding its nuances and context.
Digital businesses must also deal with challenges around integrating data from different systems and sources. Differing schema, storage methods, and encryption across various platforms can make it challenging to combine datasets for meaningful analysis.
Additionally, one of the ongoing debates in industry circles revolves around regulatory compliance such as GDPR and CCPA laws that aim at personal data protection, which might affect critical business decision-making processes when foundational information is unavailable due to privacy concerns. Some argue that complying with regulations has become an overly burdensome process while others view compliance measures as an essential step in enabling responsible use of sensitive customer data.
It's critical to note that these challenges aren't exclusively technical. Often people overlook the human component involved in using analytics tools since they're focused solely on technology; however, human factors can derail even a comprehensively designed system. For instance, introducing new processes or technology into an organization may meet resistance or cause friction due to change management issues.
The challenges mentioned here are like addressing traffic hazards during rush hour, you need a solid plan to overcome them by understanding the environment and performing preventative measures implementing policies.
Overcoming data analysis hindrances requires detailed planning and inherent flexibility. In the next section, let's examine essential business tools that can help in this process.